Measuring the Scope and Impact of Open-Source Software
This ongoing collaboration with University of Virginia, the National Center for Science and Engineering Statistics and the Bureau of Economic Analysis, we use web scraping, computational text analysis and network analysis to measure the scope and impact of open-source software development.
policy research oss networks nlp web harvesting vizCurrent economic indicators and indicators developed by the National Center for Science & Engineering Statistics (NCSES) do not measure the value of goods and services that fall outside of market transactions. Although NCSES does track some types of software development, it is challenging to account for open source software (OSS) outputs because these products are largely being advanced outside of traditional business contexts. Moreover, while current measures of innovation tend to rely on survey data, patent issues, trademarks approvals, intangible asset data, or estimates of total factor productivity growth, these measures are either incomplete or fail to capture innovation that is freely available to the public. To date, we have done work examining international collaborations, evaluating the estimated cost of open-source software on GitHub, and developing algorithms that help the NCSES classify GitHub users into different economic sectors. Learn more on UVA’s OSS website.
Kramer, B. L., Korkmaz, G., Calderón, J.B.S., Robbins, C. & Keller, S. “International Collaboration in Open Source Software: A Longitudinal Network Analysis of GitHub.” Draft Available. [GitHub Repo.]
Over the past two decades, international collaboration has more than doubled in academic research. At the same time, the open source software community has burgeoned from a collection of small, dispersed communities to a multi-billion dollar industry spanning several prominent industrial sectors around the world. To date, few studies have examined the structure of open source software development as a transnational collaboration system. In this paper, we study international collaboration networks in the open source community using data scraped from GitHub - the world’s largest remote-hosting repository platform. After collecting data from roughly 740,000 GitHub users from 241 different countries, we analyze longitudinal trends for both contributor- and country-level network data from 2008-2019. Our findings demonstrate that the contributor-level networks have grown exponentially while simultaneously becoming less dense, less centralized, and less transitive over time. In this network, GitHub users from the US have a disproportionately higher impact on collaborative efforts, as indexed by the fraction of contributions from other countries and various centrality measures. This influence carries over to the country-level networks where most nations around the world are more likely to collaborate with the US than they are to collaborate with any other country, including their own. More generally, we find that the country-level network has become more structurally integrated over time, translating to some countries, like China and India, gaining more influence in the open source community. In addition to offering novel insights about the history of open source collaboration tendencies, this paper also raises a number of important questions for future research to address.
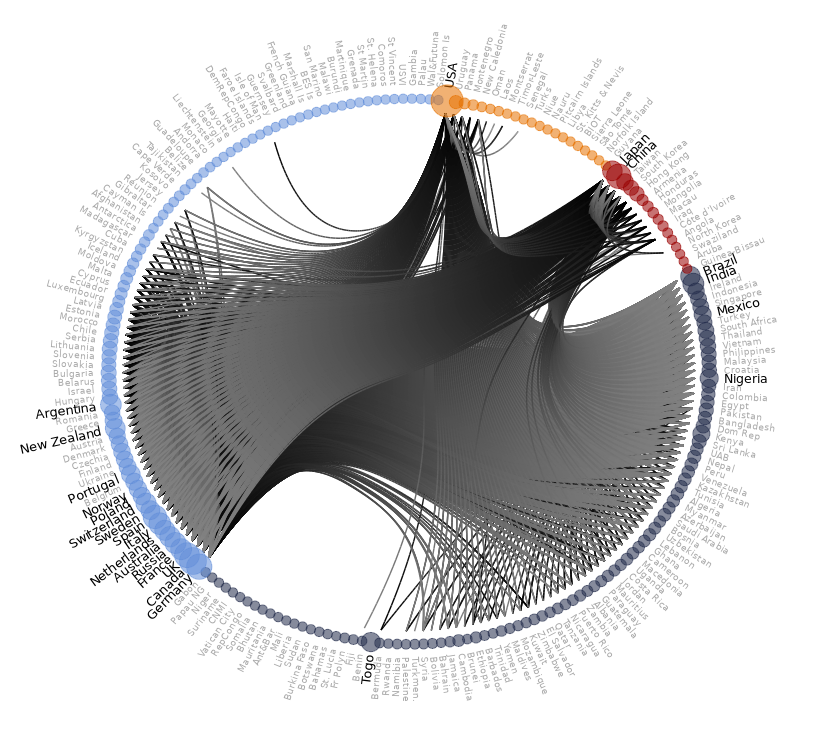
This visual shows a country-to-country collaboration network of over 740,000 GitHub users between 241 countries. Here, we collapse all users into super-nodes that correspond to the countries they report living/working in while the ties align with the number of international collaborations between countries. For visual purposes, we only show that top 30% of ties and darken the ties to signify the highest degree of incoming ties. While the color of the nodes align with a community detected using a statistical algorithm, the size of the nodes correspond to the country’s betweenness centrality - a measure that indicates a country’s capacity to bridge information across disparities geographic areas. Overall, the network helps to show the prominence of the USA, China, Japan, and a number of European countries in the OSS community
Korkmaz, G., Robbins, C., Calderon, J.B.S., Kramer, B., Schroder, A., & Keller, S. “Measuring the Cost of Open Source Software Innovation on GitHub.” Draft Available. [GitHub Repo.]
Open Source Software (OSS), defined by Open Source Initiative, is computer software with its source code shared with a license in which the copyright holder provides the rights to study, change, and distribute the software to anyone and for any purpose. OSS is developed, maintained, and extended both within and outside of the private sector, through the contribution of independent developers as well as people from universities, government research institutions, businesses, and nonprofits. Despite its ubiquity and extensive use, reliable measures of the scope and impact of OSS developed outside of the business sector are scarce. Activities around OSS development, a vital component of science activity, are not well-measured in existing federal statistics on innovation. Many of the OSS projects are developed and maintained in free repositories, such as GitHub, and information embedded in these repositories, including the code, contributors, and development activity, is publicly available. In this paper, we use data from GitHub, the largest platform with 31 million users and developers worldwide, obtaining information about OSS projects. We collect 5.2 million project repositories, containing metadata such as author, license, commits (approved code edits), and lines of code. We adopt methods used in software engineering to estimate the resource cost associated with creating OSS. We use lines of code as the measure of effort to estimate the time spent on software development and calculate the monetary value using the average compensation for computer programmers from Bureau of Labor Statistics wage data and other costs based on national accounts methodologies. The preliminary estimates show that the resource cost for developing open source software projects exceeds $928 billion dollars, based on 2017 costs.
Daniel Bullock, Morgan Klutzke, Crystal Zang, Brandon Kramer, Gizem Korkmaz, J Bayoán Santiago Calderón, and Aaron Schroeder. (2020) Sectoring Open Source Software: Where Do GitHub Contributions Come From? [GitHub Repo.]
As part of the UVA Biocomplexity Institute’s Data Science for the Public Good Program, I led a team of graduate and undergradate students in a project where we classified GitHub users into these sectors, counted which institutions users are affiliated within each sector, and researched how users collaborate within and across these various sectors. In our project, we implemented various methods, including web scraping (to collect the data), computational text analysis (to match and recode user affilations), and social network analysis (to examine collaboration tendencies). Learn more about the project on our DSPG OSS website.
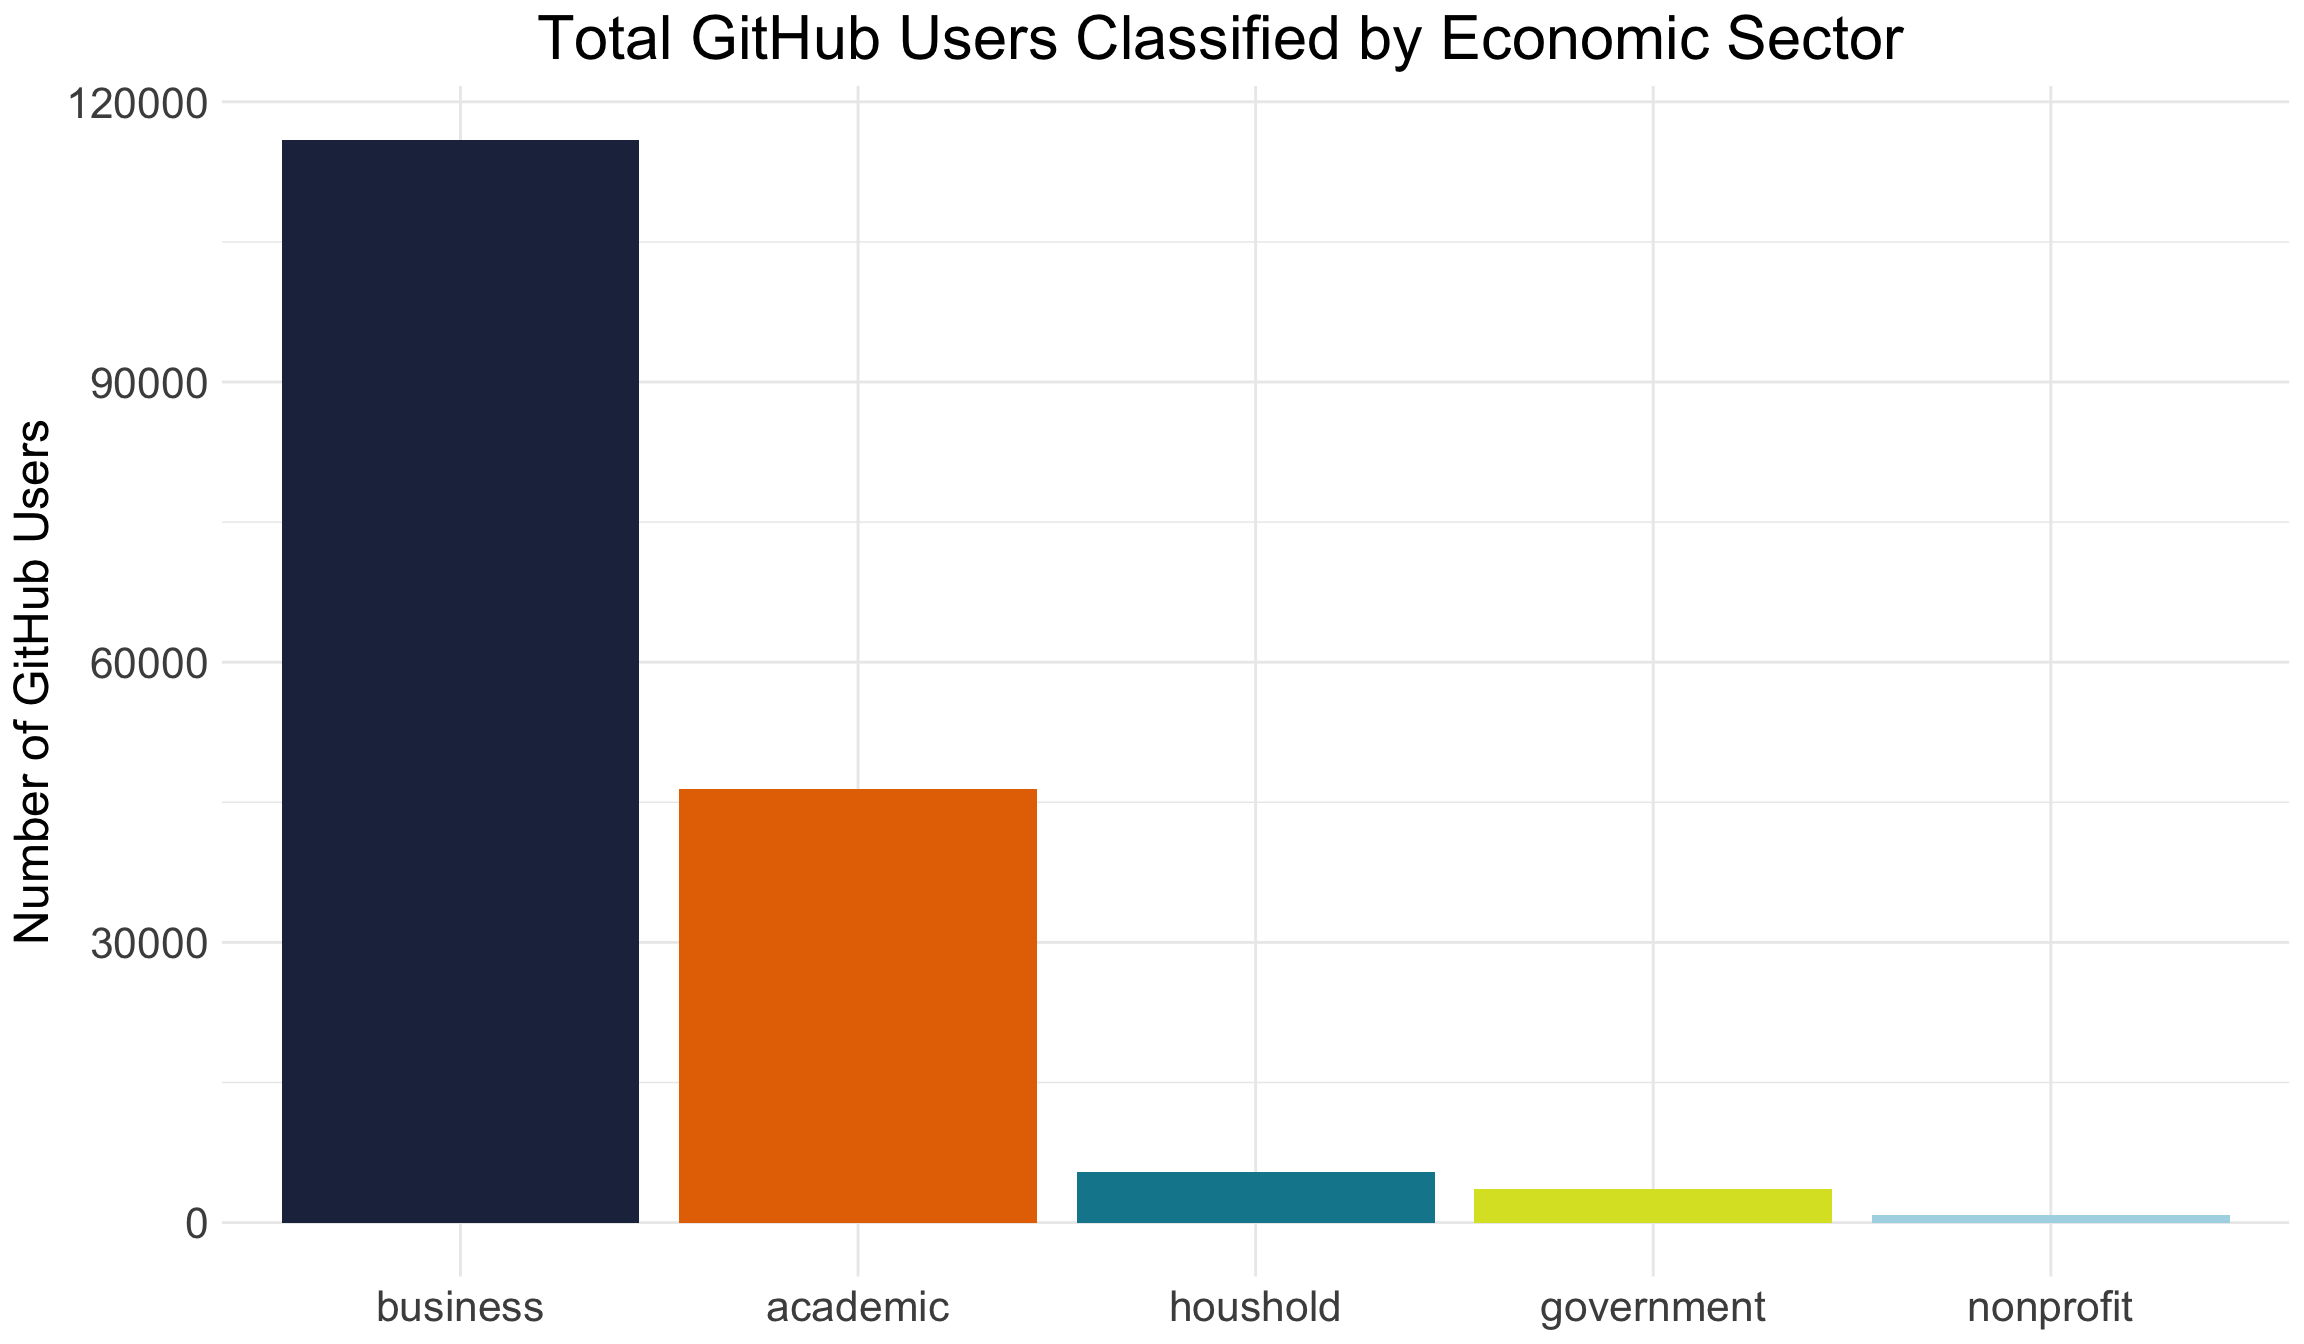
Our original GHTorrent data contained ~2.1 million users. Of these total users, only 578,852 (or 27%) had valid email information while only 422,517 (or 19.7%) had valid affiliation information. Working from this subset, we were able to classify 46,403 users into the academic sector, 5,455 users into the household sector, 3,576 users into the government sector and 823 users into the non-profit sector. After removing users that provided an organization that was listed fewer than five times, this left us with around 116,000 users that we allocated to the business sector.